Last updated: 30/09/2017, 3 min read
What is the capacity factor?
In the next few paragraphs, I will try to analyze the role of capacity factor, especially during the economic evaluation of a new power plant. First of all, what is the capacity factor? Well, the capacity factor of a power plant is the ratio of the actual output of a power plant over a period of time (usually one year) and its potential output if it had operated at full nameplate capacity the entire time. So, by its definition, the annual capacity factor could be expressed:
Due to fluctuations in the availability of the primary energy source and the necessary shutdowns for equipment’s maintenance, the capacity factor never reaches 100%. In fact, for renewable energy power plants in most cases is below 50%.
Example
A 200 MW power plant produced during 2010 around 100 GWh of energy. In this case, the capacity factor of the plant will be:
The 8760 h is the hours of a year (= 365 days/year x 24 hours/day = 8760 hours/year).
Why should I take it into account?
What really the capacity factor express is the actual net efficiency of the power plant for a given period of time. So, imagine that you design a new power plant with a named power output of 200 MW (like in the example above). When you evaluating your investment – particularly in the early stages – you might use the years of payback method. In that method, you are dividing the initial plant cost with the net annual profit, and if the result gives a “reasonable” number of years (the “reasonable” depends on the type of investment) then the investment is considered profitable, and it should be done.
Example – the “wrong way”
The above power plant has an initial cost of 1.000.000.000 €. The tricky part is how you will calculate the average annual profit of the plant. If you don’t take into account the capacity factor you might be prompt to write the following:
net annual profit = nominal power x hours of operation x MWh price – annual cost
= 200 MW x 8760 h/year x 100 €/MWh – 50.000.000 €/year = 125.200.000 €/year
If you calculate the annual profit with this method, the results are overestimated and the years of payback will be underestimated. If you repeat the previous calculations but take into account the capacity factor of the power plant, you ensure that the results are more reliable and close to reality.
Example – the “correct way”
The calculations for the above power plant are given below:
annual profit = cf x nominal power x hours of operation x MWh price – annual cost
= 0.57 x 200 MW x 8760 h/year x 70 €/MWh – 50.000.000 €/year = 50.004.160 €/year
The results with the capacity factor are a little bit depressing. The estimated net annual profit has been reduced dramatically (less than half) and the years of payback have been doubled. With these results, you may reconsider the investment.
From what factors is it affected?
The value of capacity factor strongly depends on the following factors:
- Equipment failures and scheduled maintenance, resulting in part load operation or even shutdown of the plant.
- Part load operation due to a reduction in electricity need. Since the surplus of energy cannot be provided to the grid, the plant works with lower efficiency.
- Reduction in the availability of the primary energy source. This applies mostly to renewable energy plants. For example, a hydroelectric power plant cannot operate at its nominal power if there is lack of water.
Which are the typical values of the capacity factor?
One initial step that could you take during the economic evaluation of a new power plant is to find the average capacity factor of similar plants. You can use various sources (books, internet, etc.). Using
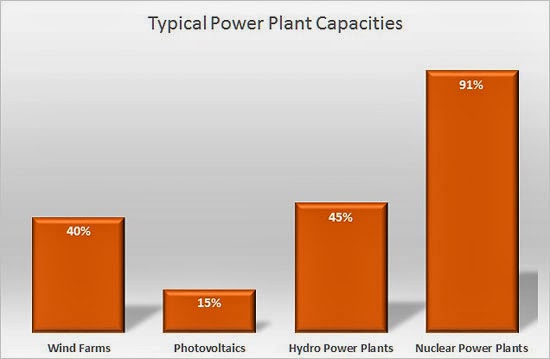
Wikipedia for example, you can find the following typical capacity factors which are represented in the above chart:
- Wind farms 20 – 40%.
- Photovoltaic solar in Massachusetts 12 – 15%.
- Photovoltaic solar in Arizona 19%.
- Hydroelectricity, worldwide average 44, range of 10% – 99% depending on design (small plant in big river will always have enough water to operate and vice versa), water availability (with or without regulation via storage dam, where a storage dam is defined to store at least enough water to operate the plant at full capacity for around half a year to allow full regulation of the annual flow of the river).
- Nuclear energy 70% (1971-2009 average of USA’s plants).
- Nuclear energy 91.2% (2010 average of USA’s plants).


.png)
.png)
